As Bitcoin flirts with the $69K mark, investors and enthusiasts alike are buzzing with anticipation. This week could bring a monumental movement in the cryptocurrency Market. What are the key signals you should watch? Stay tuned as we break down the critical indicators that could push Bitcoin past this crucial threshold. Don’t miss out on the insights that could shape your financial future!
Win Up To 93% Of Your Trades With The World’s #1 Most Profitable Trading Indicators
- Bitcoin has a strong bullish bias this week.
- The recent dip might be to engineer liquidity and more volatility was likely.
Bitcoin [BTC] was trading at the range highs at $67 at press time. This range has been in place since mid-April. The past few days’ momentum, particularly the recovery past $65k, convinced bulls that further gains were likely.
Other signals from on-chain analysis highlighted bullish sentiment in the Market. Yet, the liquidity in the $68k-$69k region could see a bearish reversal. What are the chances that this scenario would play out?
How liquidity runs can be engineered
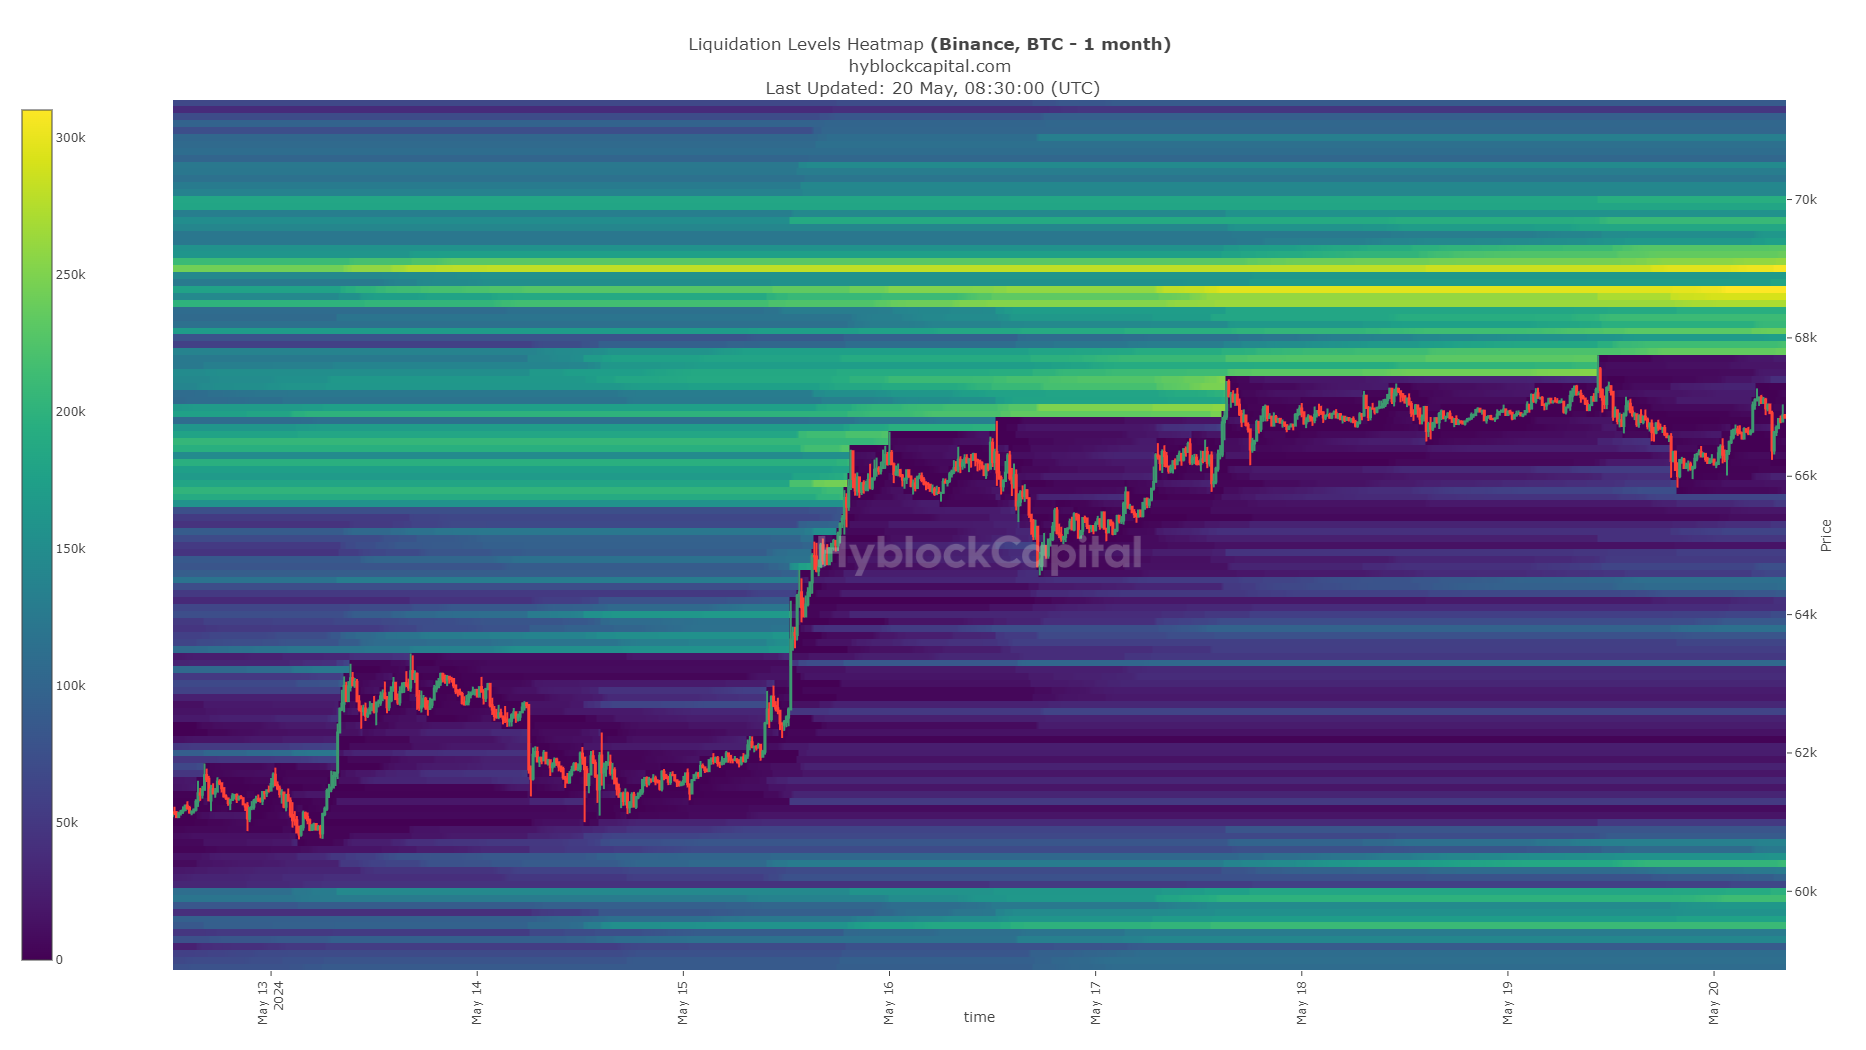
Crypto analyst CrypNuevo pointed out in a post on X (formerly Twitter) that the $69k region had a large cluster of liquidation levels. This level could attract prices in the coming days, but it could be accompanied by some volatility.
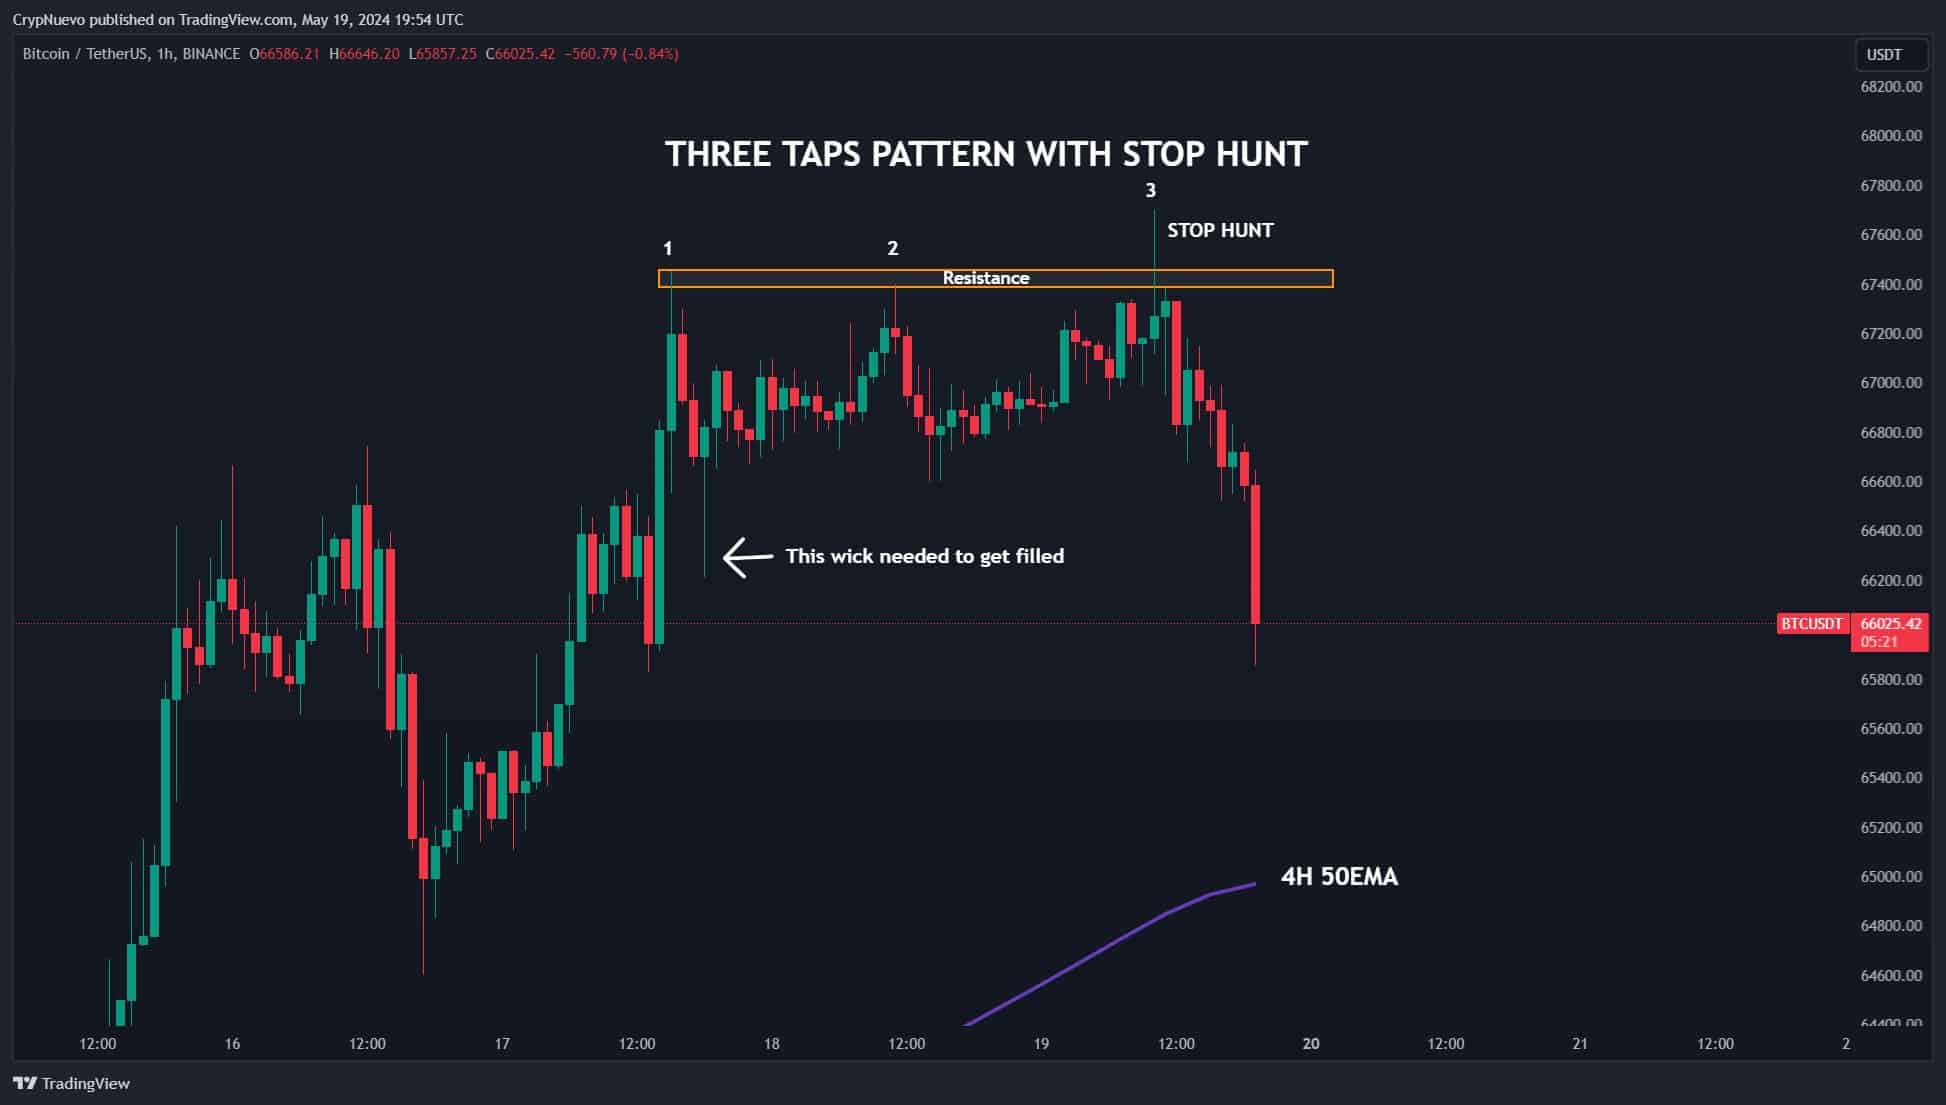
The idea is that a sharp, quick downward move before this large liquidity pocket is hit could encourage more short positions. It could also create false confidence in traders who are already short, which builds even more liquidity around the $69k region.


Source: Hyblock
He also pointed out that these aggressive moves happen at the start of the week. The 50-EMA on the 4-hour chart at $65k was another potential support for Bitcoin. Such a deep drop could encourage even more short-selling.


Source: CrypNuevo on X
However, the liquidation heatmap showcased the $68.6k-$69.2k as a critical resistance zone. The analyst expects a drop to $65k this week, followed by a rally to $69k.
What does the 4-hour timeframe technical analysis reveal?
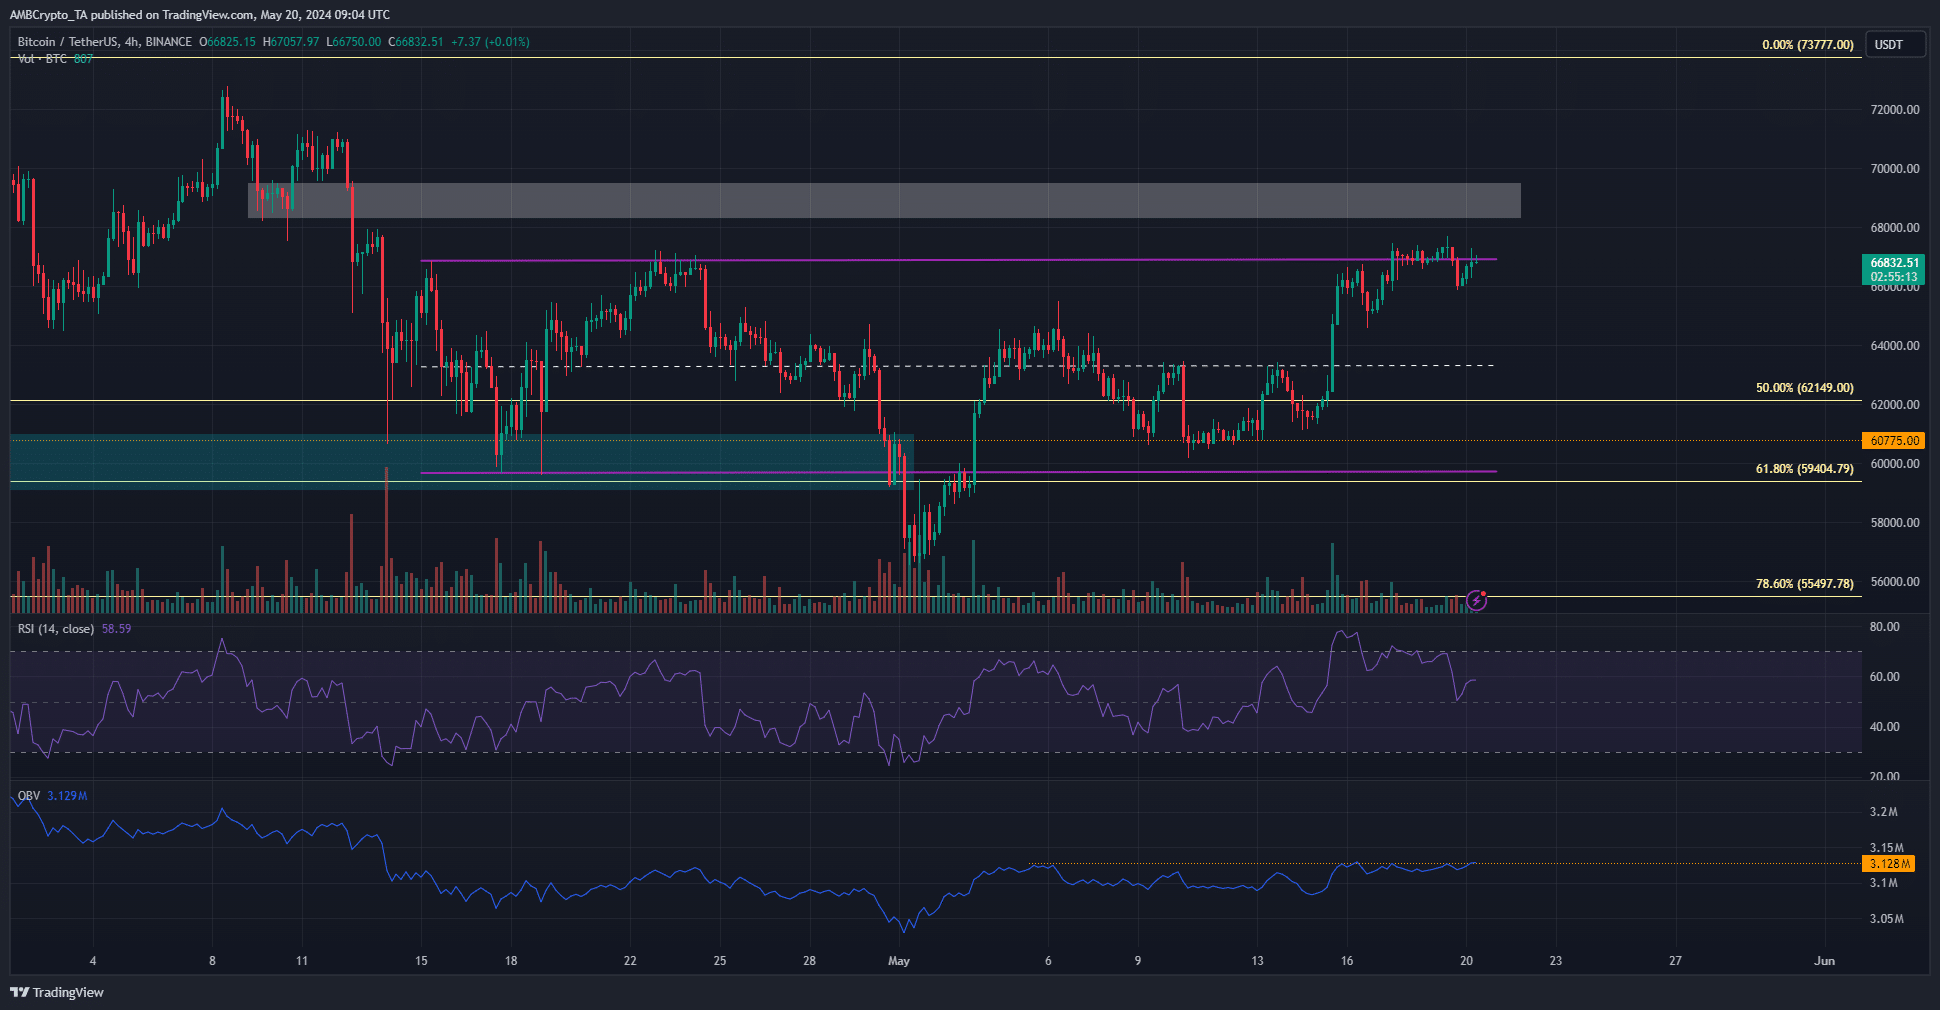
The H4 RSI continued to move above neutral 50 and indicated strong bullish momentum. Yet, the BTC trading volume has been low since Friday. However, the OBV was on the verge of clearing a local resistance level, which could add to the bullish impetus.
Is your portfolio green? Check the Bitcoin Profit Calculator
The 4-hour chart revealed strong resistance at $69k-$69.5k, but short liquidations could fuel a surge past this tricky resistance zone.
Hence, traders should be prepared for some volatility but continued bullish progress this week.
Disclaimer: The information presented does not constitute financial, investment, trading, or other types of advice and is solely the writer’s opinion.
Bitcoin Shows Bullish Bias Despite Short-Term Volatility
Bitcoin appears to be in a strong bullish phase this week, according to Market analysts. Despite a recent dip, the volatility could be part of a maneuver to attract more Market activity.
Bitcoin Price Prediction: Current Status and Momentum
Bitcoin, often referred to simply by its ticker symbol BTC, was trading at $67,000 at the time of writing. This trading range has persisted since mid-April. A recent recovery past the $65,000 mark has bolstered bullish sentiment among investors, making further gains seem likely.
Market indicators and on-chain analysis further confirm this bullish sentiment. However, some caution is warranted as the $68,000 to $69,000 range could trigger a bearish reversal. The question remains: how likely is such a scenario?
Engineering Liquidity Runs
CrypNuevo, a prominent crypto analyst, highlighted on X (formerly known as Twitter) that the $69,000 region is clustered with liquidation levels. This area could attract Bitcoin’s price but could bring along some volatility.
The strategy seems to be a sharp, quick downward move before hitting this large liquidity pocket. This move could lead to increased short positions and create false confidence among traders who are shorting Bitcoin, thereby building significant liquidity around the $69,000 mark.
Data from Hyblock indicates a critical resistance zone between $68,600 and $69,200. CrypNuevo expects Bitcoin to drop to $65,000 this week, followed by a rally to $69,000.
4-Hour Technical Analysis
Analyzing the 4-hour chart reveals key insights about Bitcoin’s trading behavior. The Relative Strength Index (RSI) remains above the neutral 50, indicating strong bullish momentum. However, trading volume has been low since Friday. On a positive note, the On-Balance Volume (OBV) is close to breaking a local resistance level, which could further propel Bitcoin upwards.
Is Your Portfolio Ready?
The 4-hour chart also shows substantial resistance at the $69,000 to $69,500 range. However, if short liquidations occur, it might catalyze a breakthrough past this difficult resistance zone. Traders should prepare for volatility but can expect continued bullish momentum this week.
Disclaimer: The information presented does not constitute financial, investment, trading, or other types of advice and is solely the writer’s opinion.
Win Up To 93% Of Your Trades With The World’s #1 Most Profitable Trading Indicators
What are key signals to watch to see if Bitcoin might break $69K this week?
Key signals include changes in trading volume, Market sentiment, big financial news, movements in tech indicator levels like RSI (Relative Strength Index), and significant buy or sell orders on major exchanges.
Can technical analysis predict if Bitcoin will hit $69K this week?
Technical analysis can give us clues but it’s not foolproof. Look at chart patterns, support and resistance levels, and key indicators like moving averages. These can suggest trends but can’t guarantee outcomes.
How can Market sentiment impact Bitcoin reaching $69K?
Market sentiment plays a big role. If people are feeling positive and buying Bitcoin, the price can go up. On the other hand, if there’s fear or uncertainty, people might sell and cause the price to drop.
Is it possible for major news to affect Bitcoin’s price this week?
Absolutely. News about regulation, technological advancements, or big corporate investments can have a big impact on Bitcoin’s price. Positive news can boost the price, while negative news can cause it to fall.
Should I rely solely on signals to invest in Bitcoin?
No, it’s important to do your own research and consider a variety of factors. While signals can be helpful, they are just one part of a larger picture. Diversify your investments to reduce risk.
Win Up To 93% Of Your Trades With The World’s #1 Most Profitable Trading Indicators
Win Up To 93% Of Your Trades With The World’s #1 Most Profitable Trading Indicators


